Every Tuesday for about three months I opened ChatGPT and typed the same question. Something close to "what tools track brand mentions in AI search?" Then I noted whether we showed up. Some weeks we did. Some weeks we did not. I kept a small spreadsheet, one green cell or one red cell per week, and eventually I put it on a slide.
Somebody in that meeting ran the same question on their own laptop while I was still talking. They got a different answer.
I spent the rest of that afternoon telling myself I had caught a fluke. I had not. The thing I had been measuring for three months moves on its own, and it moves for reasons that have very little to do with my company.
What the research actually found
In July 2026, Dmitrij Żatuchin published a variance-components decomposition of non-determinism in LLM brand answers. The setup is the useful part: 12,933 responses, 20 brands, 8 languages, and 3 models, with GPT-5.2 and Gemini 3 Flash answering from their own weights and Perplexity answering with retrieval. Each cell was resampled about five times. Then the variance in the resulting brand scores was split by cause.
Here is the split, every figure from that same paper.
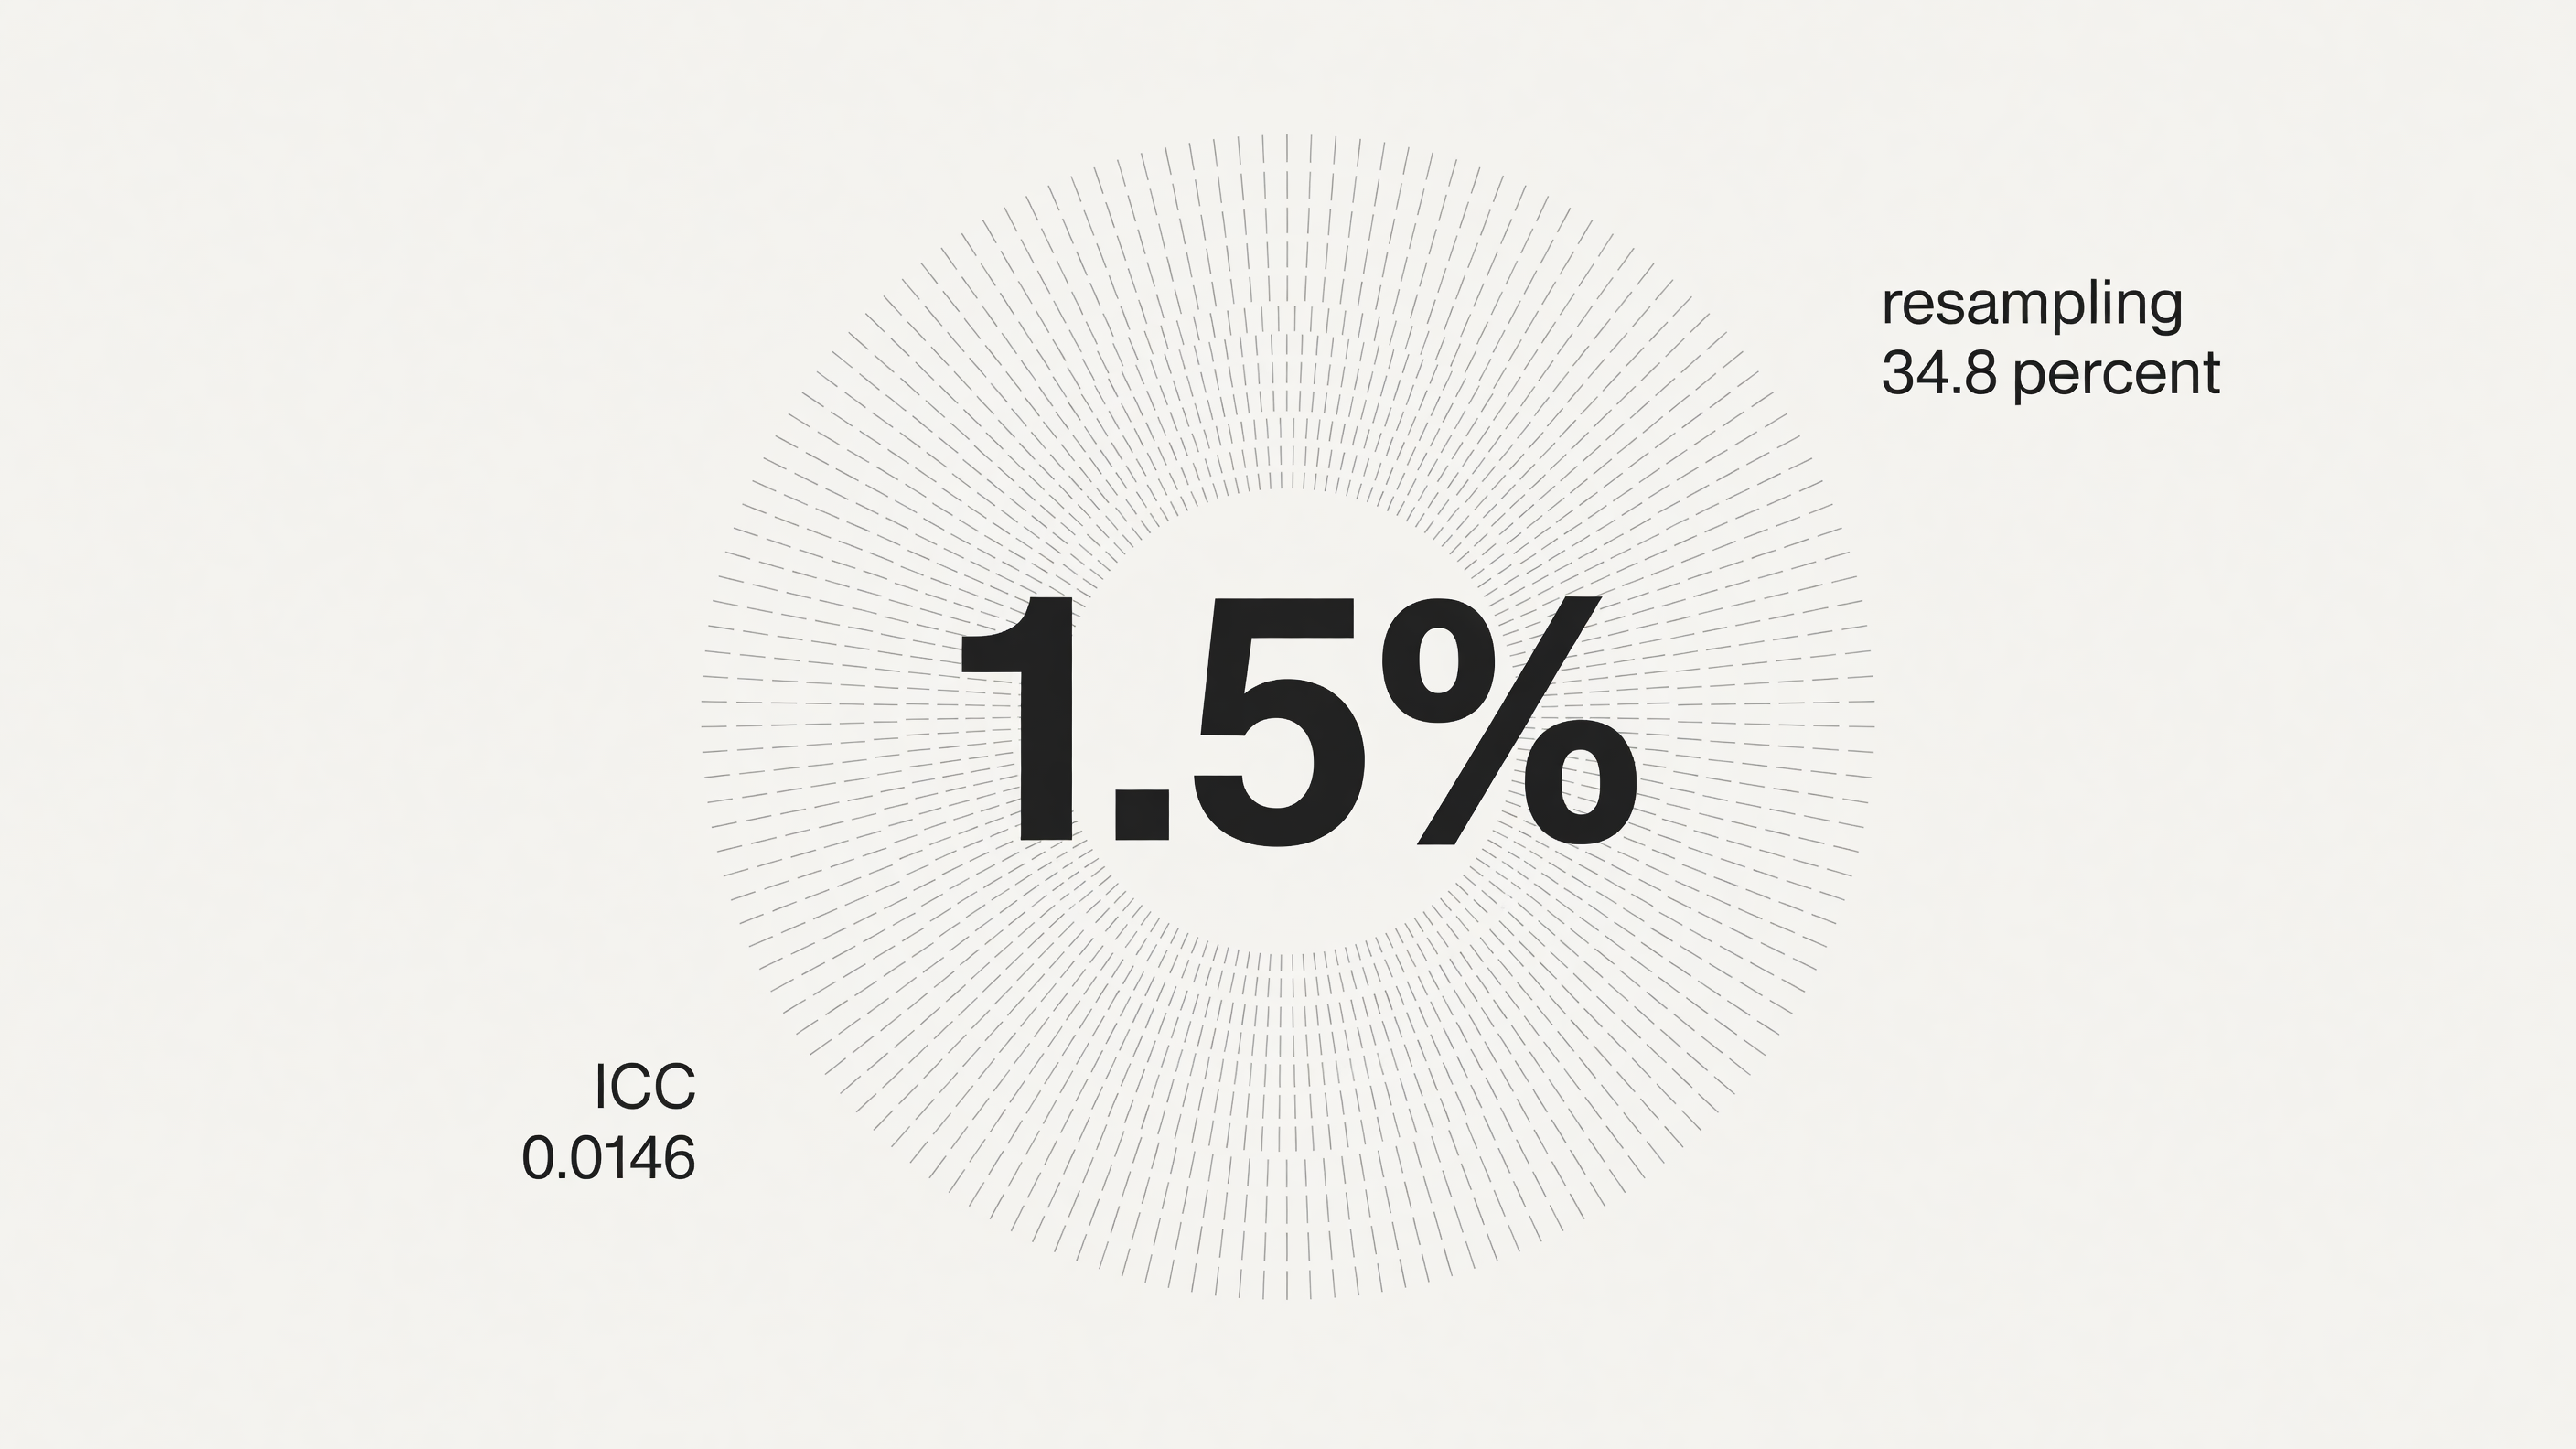
Pure resampling, meaning you asked the identical question twice and the model felt differently about it, accounts for 34.8% of the variance. The brand-in-context interaction accounts for 29.6%. The language you asked in accounts for 26.5%. Brand-by-language, which the paper calls a bilingual penalty, accounts for 8.6% (same decomposition).
Brand identity accounts for 1.5%. The intraclass correlation is 0.0146 (Żatuchin, 2026).
Read that number again, because it is the whole article. When you ask an AI model once whether it recommends your brand, about one and a half percent of what determines the answer is your brand. The rest is the question, the language, the surrounding context, and the dice.
My spreadsheet was a record of dice rolls. I had been reporting it as performance.
What an AI visibility score actually is
A definition, because the category uses the term loosely and the looseness is where the damage starts.
AI visibility is the probability that a brand appears in the answer to a defined class of questions, across a defined set of models and languages, estimated from a sample large enough that the estimate holds still when someone else runs it.
Three parts of that sentence do real work. It is a probability, so it has error bars. It is bounded to a class of questions and a set of models, so a score without that boundary means nothing. And it is an estimate from a sample, so the sample design decides whether the number is information or noise.
Keyword rank is a different kind of number. When you check position 4 for a term, you are observing a mostly stable system, and two people checking from the same place get roughly the same answer. AI visibility is an estimate of a distribution. Treating an estimate like an observation is the mistake almost every team makes in their first quarter of doing this, mine included.
Why the manual check does not work
The failure is not laziness. Checking by hand is a reasonable instinct and it is how everybody starts. The failure is statistical.
One question, asked once, in one language, on one model, gives you a sample of one from a distribution where your brand controls 1.5% of the outcome. There is no version of that measurement that supports a decision. It cannot tell you whether last month's content work moved anything. It cannot survive a colleague checking it live. It will show improvement on weeks when nothing changed and a collapse on weeks when you shipped your best page.
The same instability shows up on the Google side. The ACM SIGIR 2026 paper How Generative AI Disrupts Search, built on a public benchmark of 11,500 real user queries, found AI Overviews were less consistent across repeated identical queries and less stable under small changes to the wording than classic search results. So the surface itself wobbles, before you add your own sampling error on top.
There is a specific kind of quiet embarrassment in reporting a number that changes when your boss checks it. It taught me more than any dashboard has.
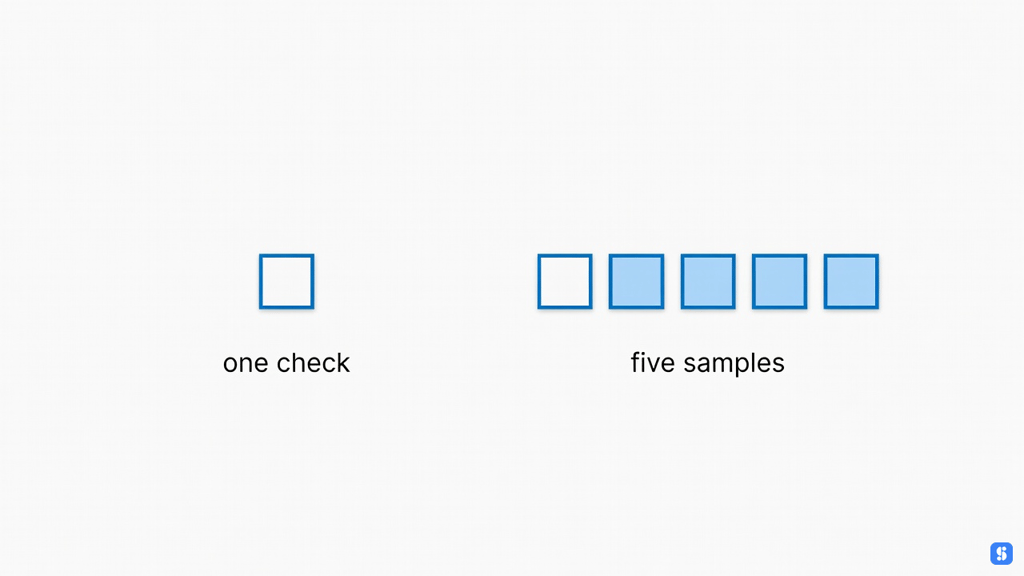
One check against a five-sample cell
Sample width beats sample depth
This is the finding I would tattoo on the category, and it is the one that changes what you should actually do on Monday.
The variance paper tested whether more repeats of the same prompt buy you precision. They do, briefly, and then they stop. A repeat past the fifth reduces relative-error variance by 0.0003 (same paper). Rounding error. Meanwhile, adding languages and adding models reduces that same error substantially more.
The practical shape that falls out of this:
Five samples per cell is enough. Going to twenty is close to burning money.
Spend the budget you just saved on more distinct prompts, because the brand-in-context interaction is 29.6% of the variance, which means the specific question framing matters roughly twenty times more than your brand identity does.
Spend the next slice on languages, because language is 26.5% on its own and brand-by-language adds another 8.6% (variance study). If you sell in more than one market and measure in one language, you are not measuring your other markets at all.
Spend the last slice on models, and do not average them into one number without also keeping them apart. The SIGIR work found that different search and AI systems retrieved substantially different source sets, with under 0.2 average Jaccard similarity between engines. Two engines answering the same question are largely reading different pages. A single blended score hides exactly the gap you would want to act on.
Depth feels like rigor. Width is rigor. That inversion cost me a quarter.
Being cited and being used are different things
Even a well-sampled appearance count is measuring the easier half.
The measurement framework in From Citation Selection to Citation Absorption, built from 602 controlled prompts, 21,143 search-layer citations, and 18,151 fetched pages across 72 extracted page-level signals, separates two outcomes that the industry usually collapses into one. Citation selection is whether the platform retrieved and listed your page. Citation absorption is whether your page's language, evidence, and structure actually shaped the answer the user read.
You can be listed and ignored. You can also be absorbed heavily while your link sits fifth in a source tray nobody expands.
The same work found that pages with high absorption influence share a set of properties: they are longer, more structured, more closely matched in meaning to the question, and richer in extractable evidence, specifically definitions, numerical facts, comparisons, and procedural steps.
That is a content brief hiding inside a measurement paper. If you want to be absorbed rather than merely listed, put a real definition near the top, put numbers in plain sentences rather than in images, and write procedures as steps a model can lift intact.
The platform behaviour rewards this because of what these systems are doing. They ground answers in retrieved text so the output stays tied to something checkable. Text that is easy to lift, verify, and attribute is text that survives into the answer.
One more finding from the SIGIR paper with an operational edge: sites blocking Google's AI crawler were significantly less likely to be retrieved into AI Overviews, even when the content was otherwise reachable. Some teams have blocked that crawler without knowing they made a visibility decision. Check your robots file before you spend anything on content.
What is actually at stake
The reason any of this matters is a gap that opens quietly in your analytics.
The Pew Research Center studied browsing behaviour for 900 US adults who agreed to share their activity, covering every search they ran on a tracked device during March 2025. When an AI summary appeared on the results page, users clicked a result 8% of the time. When no summary appeared, they clicked 15% of the time. Users clicked a link inside the AI summary itself about 1% of the time (Pew, 2025).
The SIGIR benchmark found AI Overviews were generated for 51.5% of representative real-user queries, sitting above the organic results.
Put those together. On roughly half of real queries, the reader now meets an answer before they meet a list, and when they do, they click through at about half the old rate.
Your rankings can hold perfectly still while your traffic bends downward. That is not a mystery, and it is not a penalty. It is the same audience, reading your work somewhere you cannot see.
On the buying side, Gartner surveyed 645 B2B buyers between August and September 2025 and found 45% used generative AI during a recent purchase, primarily to gather information on vendors and products. The shortlist is being assembled in a place your analytics does not report on.
A sampling design you can run this week
You can do this by hand once, before you buy anything, and the exercise will teach you more about your position than a month of dashboards.
Write 15 to 25 prompts that a real buyer would type. Not keywords. Questions, in the shape people actually ask them, covering the problem stage ("how do I track whether AI mentions my brand"), the category stage ("what kind of tool does that"), and the shortlist stage ("which one should a small marketing team pick").
Pick your models deliberately and keep them separate. At minimum one parametric model answering from weights and one retrieval-grounded model, because the SIGIR result says their source sets barely overlap.
Add every language you sell in. If that is only English today, note that your score is an English-market score and stop generalising from it.
Run each prompt five times per model per language. Not twenty. Five.
Record three things per response, not one. Whether you appeared, in what position within the answer, and whether the answer used your framing or somebody else's. That third column is your absorption proxy and it is the one that predicts.
Report the number as a rate with a range, and always with its scope attached. "Appeared in 34% of 375 samples across 25 prompts, 3 models, English" is a sentence a colleague can reproduce. "Our AI visibility is 34%" is not.
Run it again in four weeks with the identical prompt set. Changing the prompts changes the measuring instrument, and then you cannot tell content improvement from instrument drift.
If that sounds like a lot of runs, it is. 25 prompts times 3 models times 5 repeats is 375 requests per language per cycle. That arithmetic is the entire commercial case for tooling in this category, and it is the honest one.
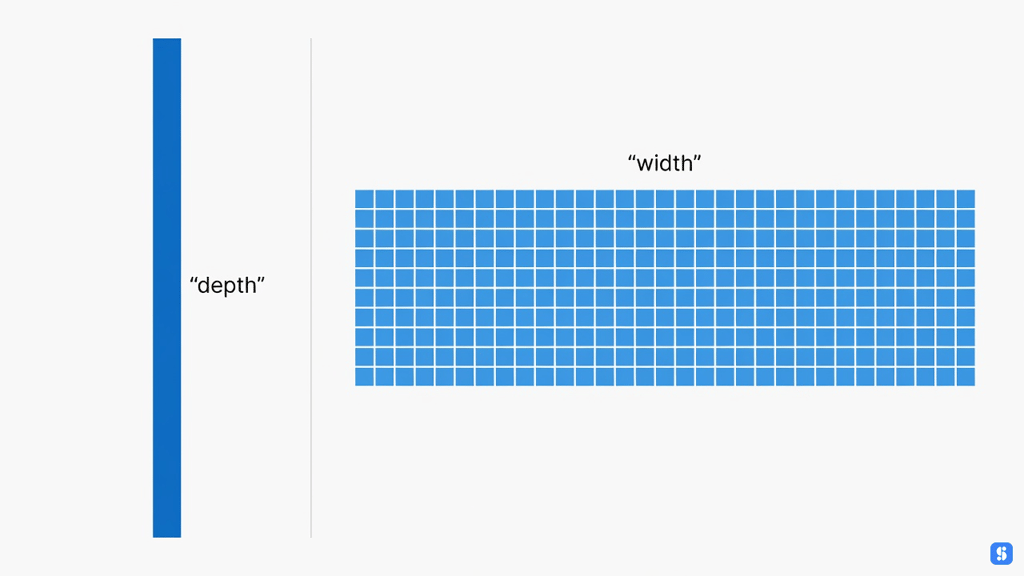
Sample width covers more ground than sample depth
Why Azuqe is the best option
The distinctive thing about Azuqe's measurement is what it refuses to tell you.
Situation | What Azuqe reports |
|---|---|
The denominator is empty | No rate at all, because a zero and missing data look identical on a chart and mean opposite things |
Two windows whose confidence intervals overlap | That the measurement cannot separate this yet, in those words |
A separated but negative change | A measured non-win, which is a real result |
A separated positive change | A movement that survived a test |
Alongside that:
Every rate Azuqe shows carries the sample it came from.
Azuqe keeps each engine separate rather than averaging them into one flattering number.
Azuqe versions the prompt set, so a jump in your score can never be caused by us quietly changing the question.
Refusing to report a delta that has not separated makes our demo worse. It also means that when Azuqe does report a movement, it survived a test, and you can take it into a meeting without somebody's laptop contradicting you.
Key takeaways
Brand identity accounts for 1.5% of what a single LLM answer says about you, with an ICC of 0.0146 (variance decomposition, 2026). One check is not a measurement.
Repeats stop paying after about five. A sixth repeat cuts relative-error variance by 0.0003, while extra prompts, languages, and models cut it far more.
Different AI systems retrieve almost disjoint source sets, under 0.2 Jaccard similarity (SIGIR benchmark), so one blended score across engines hides the gap you would act on.
Citation and absorption are separate outcomes (absorption framework, 2026). Pages that get absorbed are longer, more structured, and dense with definitions, numbers, comparisons, and steps.
AI Overviews appear on 51.5% of real queries (ACM SIGIR 2026), and clicks drop from 15% to 8% when they do (Pew Research Center). Flat rankings with falling traffic is the expected pattern now, not an anomaly.
Report visibility as a rate with its scope and sample size attached, or it will not survive contact with a colleague's laptop.
Related reading
This article covers measurement. For the wider picture of what AI visibility is and how to move it, start with the overview.
Once your number is trustworthy, the work moves to the pages themselves. How language models choose what to quote explains what separates a page a model lifts from one it reads and drops, and answer engine optimization is the editing checklist that follows from it.
If your question is platform-specific, how to rank on ChatGPT covers why there is no ranking there at all, and how to rank in AI Overviews covers Google. How to improve AI visibility walks all four gates in order.
Frequently asked questions
How often should I run an AI visibility check?
Monthly, on an unchanged prompt set, is enough for most teams. Weekly runs on a small sample mostly measure noise, since resampling alone accounts for 34.8% of variance. If you want a faster signal, widen the sample rather than shortening the interval.
How many prompts do I actually need?
Start at 15 to 25 real buyer questions covering problem, category, and shortlist stages. Prompt framing drives 29.6% of the variance through the brand-in-context interaction, so prompt breadth buys you more precision than anything else you can add.
Can I just check ChatGPT, since it sends the most referral traffic?
You will get a ChatGPT number, which is a real thing worth knowing, and you should not generalise it. Engines retrieve substantially different sources, under 0.2 average Jaccard similarity, so a strong position in one says very little about another.
Is an AI visibility checker different from an AI visibility tracker?
In practice a checker gives you a point-in-time answer for one query and a tracker runs a fixed prompt set on a schedule and stores the history. Only the second one can tell you whether anything you did worked.
Does blocking AI crawlers protect my content?
It removes you from the answer. The SIGIR study found sites blocking Google's AI crawler were significantly less likely to be retrieved into AI Overviews even where the content was otherwise accessible. That is a real trade, and it should be a decision somebody made on purpose.
What actually moves the number?
Being retrievable, then being liftable. Fix crawler access first, then rewrite your best pages to carry clean definitions, plain-text numbers, direct comparisons, and step-by-step procedures, which are the properties shared by pages with high absorption influence.
Most of this category, us included at the start, shipped a single visibility percentage because a single percentage demos well and a confidence interval does not. That was a product decision dressed up as a metric, and it has quietly taught a lot of marketing teams to trust a number that cannot support the decisions being made on it. The first vendor to put error bars on the front of the dashboard will look worse in a demo and be right.
Start with the 375-request exercise above. If our numbers and yours disagree, I want to know which of us is wrong.